
Certificate expiry is the number one cause of preventable outages. Every year, major services go down because a certificate expired without anyone noticing — not because the team was negligent, but because monitoring wasn’t in place or didn’t cover every certificate in the environment.
Prometheus and Grafana give you a battle-tested stack for certificate expiry monitoring. This guide covers three approaches: the x509-certificate-exporter for file-based and Kubernetes certificates, the Blackbox exporter for probing external endpoints, and cert-manager’s built-in metrics. You’ll get working configs for each, PromQL queries, Grafana dashboards, and AlertManager rules that notify your team at 30, 14, and 7 days before expiry.
Monitoring Architecture Overview
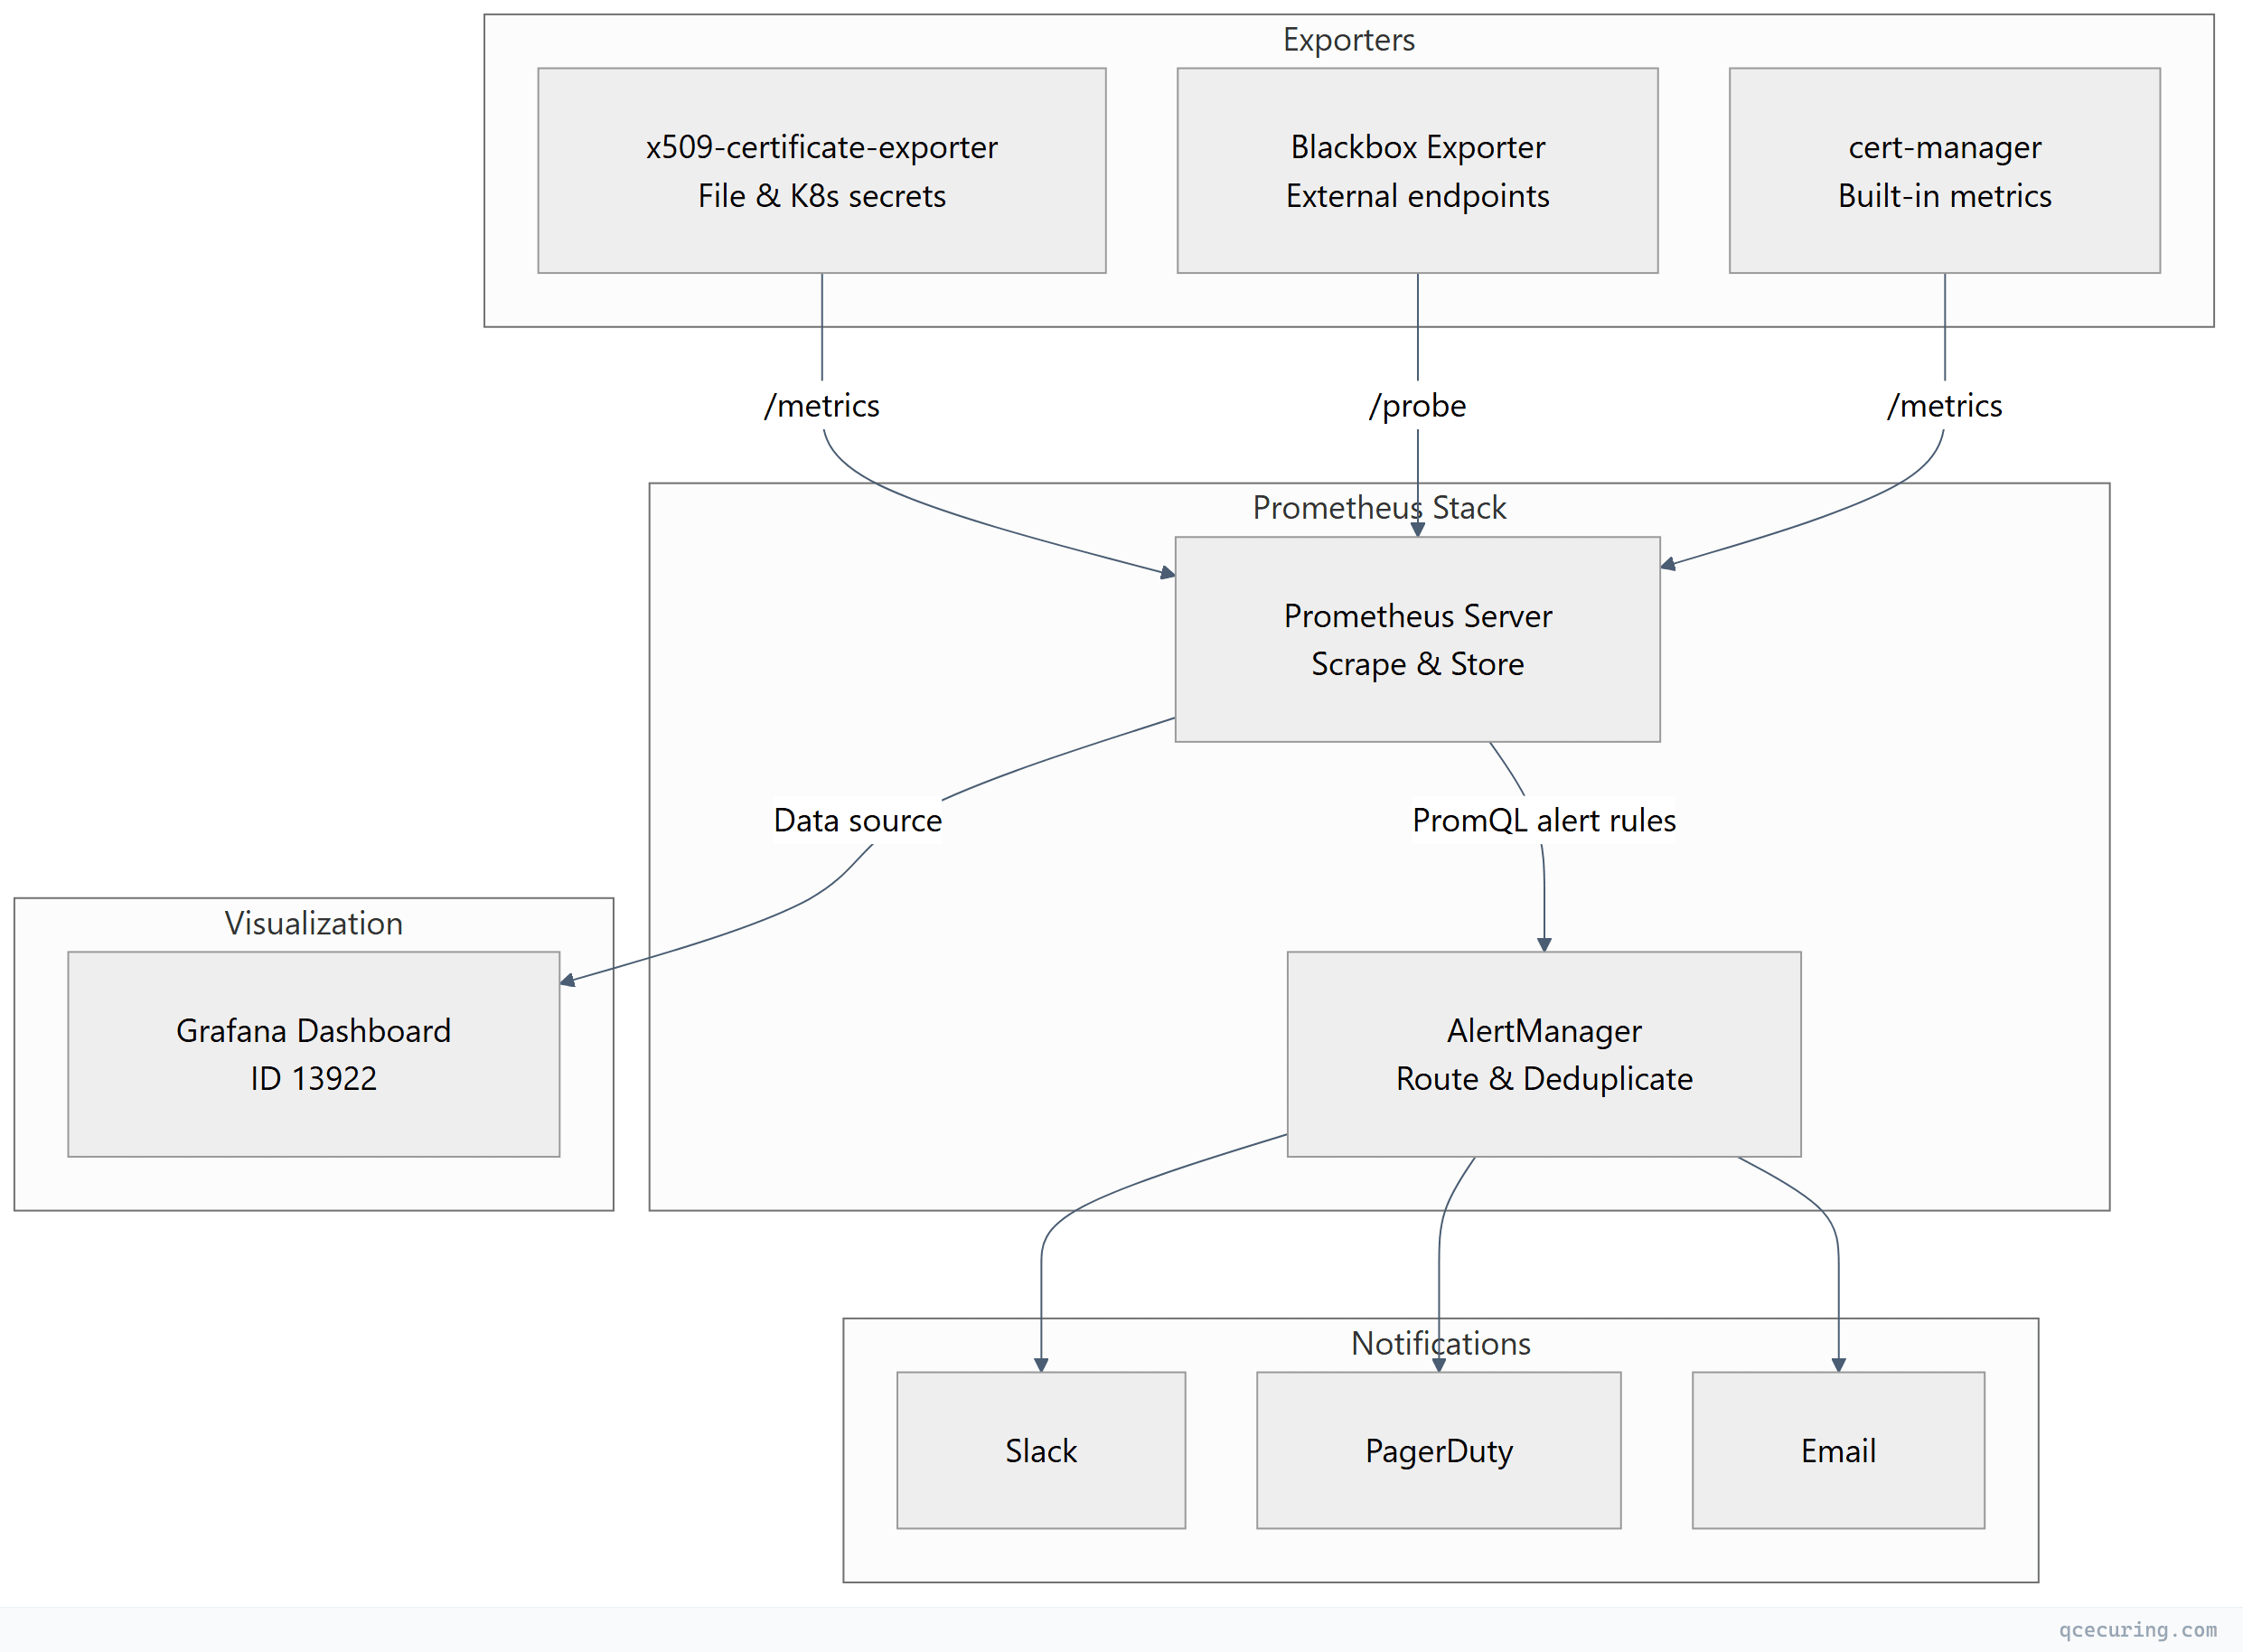
Option 1: x509-certificate-exporter
The x509-certificate-exporter is a lightweight Prometheus exporter purpose-built for certificate monitoring. It watches certificate files on disk, Kubernetes TLS secrets, and kubeconfig files.
Installation via Helm (Kubernetes)
helm repo add enix https://charts.enix.io
helm repo update

helm install x509-exporter enix/x509-certificate-exporter \
  --namespace monitoring \
  --create-namespace \
  --set secretsExporter.enabled=true \
  --set hostPathsExporter.daemonSets[0].watchFiles[0]=/etc/ssl/certs \
  --set hostPathsExporter.daemonSets[0].watchFiles[1]=/etc/pki/tls/certs
Installation as Standalone Binary
# Download latest release
curl -LO https://github.com/enix/x509-certificate-exporter/releases/latest/download/x509-certificate-exporter-linux-amd64.tar.gz
tar xzf x509-certificate-exporter-linux-amd64.tar.gz
sudo mv x509-certificate-exporter /usr/local/bin/

# Run with watched paths
x509-certificate-exporter \
  --watch-file=/etc/ssl/certs/server.crt \
  --watch-file=/etc/letsencrypt/live/*/fullchain.pem \
  --listen-address=:9793
Systemd Service
# /etc/systemd/system/x509-certificate-exporter.service
[Unit]
Description=x509 Certificate Exporter
After=network.target

[Service]
Type=simple
ExecStart=/usr/local/bin/x509-certificate-exporter \
  --watch-file=/etc/ssl/certs/server.crt \
  --watch-file=/etc/letsencrypt/live/*/fullchain.pem \
  --watch-file=/etc/pki/tls/certs/*.crt \
  --listen-address=:9793
Restart=always
RestartSec=5

[Install]
WantedBy=multi-user.target
sudo systemctl daemon-reload
sudo systemctl enable --now x509-certificate-exporterKey Metrics
| Metric | Description |
|---|---|
x509_cert_not_after | Certificate expiry timestamp (Unix epoch) |
x509_cert_not_before | Certificate valid-from timestamp |
x509_cert_expired | 1 if expired, 0 if valid |
x509_cert_valid_since_seconds | Seconds since certificate became valid |
x509_cert_expires_in_seconds | Seconds until expiry |
Prometheus Scrape Config
# prometheus.yml
scrape_configs:
  - job_name: 'x509-certificate-exporter'
    static_configs:
      - targets: ['localhost:9793']
    scrape_interval: 60s
    scrape_timeout: 30s
Option 2: Blackbox Exporter (External Endpoint Probing)
The Blackbox exporter probes HTTPS endpoints and exposes the probe_ssl_earliest_cert_expiry metric — the Unix timestamp of the earliest certificate expiry in the chain.
Installation
# Download
curl -LO https://github.com/prometheus/blackbox_exporter/releases/latest/download/blackbox_exporter-0.25.0.linux-amd64.tar.gz
tar xzf blackbox_exporter-*.tar.gz
sudo mv blackbox_exporter-*/blackbox_exporter /usr/local/bin/
Blackbox Exporter Configuration
# /etc/blackbox_exporter/config.yml
modules:
  https_cert_check:
    prober: http
    timeout: 10s
    http:
      method: GET
      preferred_ip_protocol: ip4
      tls_config:
        insecure_skip_verify: false
      valid_http_versions: ["HTTP/1.1", "HTTP/2.0"]
      valid_status_codes: [200, 301, 302, 403]
      fail_if_ssl: false
Prometheus Scrape Config for Blackbox
# prometheus.yml
scrape_configs:
  - job_name: 'blackbox-ssl'
    metrics_path: /probe
    params:
      module: [https_cert_check]
    static_configs:
      - targets:
          - https://app.example.com
          - https://api.example.com
          - https://admin.example.com
          - https://mail.example.com
    relabel_configs:
      - source_labels: [__address__]
        target_label: __param_target
      - source_labels: [__param_target]
        target_label: instance
      - target_label: __address__
        replacement: blackbox-exporter:9115  # Blackbox exporter address
    scrape_interval: 300s  # Every 5 minutes is sufficient for cert checks
Key Metric
# Days until certificate expires
(probe_ssl_earliest_cert_expiry - time()) / 86400
Option 3: cert-manager Metrics (Kubernetes)
If you’re running cert-manager in Kubernetes, it already exposes certificate metrics. No additional exporter needed.
Enable Prometheus Metrics
# cert-manager Helm values
prometheus:
  enabled: true
  servicemonitor:
    enabled: true
    namespace: monitoring
    labels:
      release: prometheus
Or if cert-manager is already installed:
helm upgrade cert-manager jetstack/cert-manager \
  --namespace cert-manager \
  --set prometheus.enabled=true \
  --set prometheus.servicemonitor.enabled=true
Key Metrics
| Metric | Description |
|---|---|
certmanager_certificate_expiration_timestamp_seconds | Expiry timestamp per certificate |
certmanager_certificate_ready_status | 1 if certificate is ready, 0 if not |
certmanager_certificate_renewal_timestamp_seconds | When cert-manager will attempt renewal |
Prometheus Scrape Config (if not using ServiceMonitor)
scrape_configs:
  - job_name: 'cert-manager'
    kubernetes_sd_configs:
      - role: pod
        namespaces:
          names: ['cert-manager']
    relabel_configs:
      - source_labels: [__meta_kubernetes_pod_label_app]
        regex: cert-manager
        action: keep
      - source_labels: [__meta_kubernetes_pod_annotation_prometheus_io_port]
        target_label: __address__
        regex: (.+)
        replacement: ${1}:9402
PromQL Queries for Certificate Monitoring
Days Until Expiry (x509-exporter)
# Days remaining for each certificate
x509_cert_expires_in_seconds / 86400
Days Until Expiry (Blackbox)
# Days remaining for probed endpoints
(probe_ssl_earliest_cert_expiry - time()) / 86400
Days Until Expiry (cert-manager)
# Days remaining for Kubernetes certificates
(certmanager_certificate_expiration_timestamp_seconds - time()) / 86400
Certificates Expiring Within 30 Days
# x509-exporter
x509_cert_expires_in_seconds < 2592000

# Blackbox
(probe_ssl_earliest_cert_expiry - time()) < 2592000

# cert-manager
(certmanager_certificate_expiration_timestamp_seconds - time()) < 2592000
Already Expired Certificates
x509_cert_expired == 1AlertManager Rules
Create alert rules that fire at 30, 14, and 7 days before expiry:
# /etc/prometheus/rules/certificate-alerts.yml
groups:
  - name: certificate_expiry
    rules:
      - alert: CertificateExpiring30Days
        expr: |
          (x509_cert_expires_in_seconds < 2592000 and x509_cert_expires_in_seconds > 0)
          or
          ((probe_ssl_earliest_cert_expiry - time()) < 2592000 and (probe_ssl_earliest_cert_expiry - time()) > 0)
          or
          ((certmanager_certificate_expiration_timestamp_seconds - time()) < 2592000 and (certmanager_certificate_expiration_timestamp_seconds - time()) > 0)
        for: 1h
        labels:
          severity: warning
        annotations:
          summary: "Certificate expiring within 30 days"
          description: "Certificate {{ $labels.filepath }}{{ $labels.instance }}{{ $labels.name }} expires in {{ $value | humanizeDuration }}."

      - alert: CertificateExpiring14Days
        expr: |
          (x509_cert_expires_in_seconds < 1209600 and x509_cert_expires_in_seconds > 0)
          or
          ((probe_ssl_earliest_cert_expiry - time()) < 1209600 and (probe_ssl_earliest_cert_expiry - time()) > 0)
          or
          ((certmanager_certificate_expiration_timestamp_seconds - time()) < 1209600 and (certmanager_certificate_expiration_timestamp_seconds - time()) > 0)
        for: 1h
        labels:
          severity: high
        annotations:
          summary: "Certificate expiring within 14 days"
          description: "Certificate {{ $labels.filepath }}{{ $labels.instance }}{{ $labels.name }} expires in {{ $value | humanizeDuration }}. Immediate renewal required."

      - alert: CertificateExpiring7Days
        expr: |
          (x509_cert_expires_in_seconds < 604800 and x509_cert_expires_in_seconds > 0)
          or
          ((probe_ssl_earliest_cert_expiry - time()) < 604800 and (probe_ssl_earliest_cert_expiry - time()) > 0)
          or
          ((certmanager_certificate_expiration_timestamp_seconds - time()) < 604800 and (certmanager_certificate_expiration_timestamp_seconds - time()) > 0)
        for: 30m
        labels:
          severity: critical
        annotations:
          summary: "Certificate expiring within 7 days — CRITICAL"
          description: "Certificate {{ $labels.filepath }}{{ $labels.instance }}{{ $labels.name }} expires in {{ $value | humanizeDuration }}. Service outage imminent if not renewed."

      - alert: CertificateExpired
        expr: |
          x509_cert_expired == 1
          or
          (probe_ssl_earliest_cert_expiry - time()) <= 0
          or
          (certmanager_certificate_expiration_timestamp_seconds - time()) <= 0
        for: 5m
        labels:
          severity: critical
        annotations:
          summary: "Certificate has EXPIRED"
          description: "Certificate {{ $labels.filepath }}{{ $labels.instance }}{{ $labels.name }} has expired. Service is likely experiencing TLS failures."
AlertManager Configuration: Slack & PagerDuty
# /etc/alertmanager/alertmanager.yml
global:
  resolve_timeout: 5m
  slack_api_url: 'https://hooks.slack.com/services/YOUR/SLACK/WEBHOOK'
  pagerduty_url: 'https://events.pagerduty.com/v2/enqueue'

route:
  group_by: ['alertname', 'instance']
  group_wait: 30s
  group_interval: 5m
  repeat_interval: 4h
  receiver: 'slack-warnings'
  routes:
    - match:
        severity: critical
      receiver: 'pagerduty-critical'
      repeat_interval: 1h
    - match:
        severity: high
      receiver: 'slack-high'
      repeat_interval: 2h
    - match:
        severity: warning
      receiver: 'slack-warnings'
      repeat_interval: 12h

receivers:
  - name: 'slack-warnings'
    slack_configs:
      - channel: '#cert-alerts'
        title: '⚠️ Certificate Expiry Warning'
        text: |
          *Alert:* {{ .GroupLabels.alertname }}
          *Instance:* {{ .CommonLabels.instance }}
          *Description:* {{ .CommonAnnotations.description }}
          *Severity:* {{ .CommonLabels.severity }}
        send_resolved: true

  - name: 'slack-high'
    slack_configs:
      - channel: '#cert-alerts'
        title: '🔶 Certificate Expiry — Action Required'
        text: |
          *Alert:* {{ .GroupLabels.alertname }}
          *Instance:* {{ .CommonLabels.instance }}
          *Description:* {{ .CommonAnnotations.description }}
        send_resolved: true

  - name: 'pagerduty-critical'
    pagerduty_configs:
      - service_key: 'YOUR_PAGERDUTY_SERVICE_KEY'
        severity: critical
        description: '{{ .CommonAnnotations.summary }}'
        details:
          instance: '{{ .CommonLabels.instance }}'
          description: '{{ .CommonAnnotations.description }}'
Grafana Dashboard Setup
Import Pre-Built Dashboard
The community dashboard ID 13922 provides a ready-made certificate monitoring view for the x509-certificate-exporter:
- Open Grafana → Dashboards → Import
- Enter dashboard ID:
13922 - Select your Prometheus data source
- Click Import
Custom Dashboard Panels
For a unified view across all three exporters, create custom panels:
Panel 1: Certificate Expiry Table
# Combine all sources into a single table
sort_desc(
  label_replace(x509_cert_expires_in_seconds / 86400, "source", "file", "", "")
  or
  label_replace((probe_ssl_earliest_cert_expiry - time()) / 86400, "source", "endpoint", "", "")
  or
  label_replace((certmanager_certificate_expiration_timestamp_seconds - time()) / 86400, "source", "k8s", "", "")
)
Panel 2: Certificates Expiring Soon (Stat Panel)
count(x509_cert_expires_in_seconds < 2592000 and x509_cert_expires_in_seconds > 0)
+
count((probe_ssl_earliest_cert_expiry - time()) < 2592000 and (probe_ssl_earliest_cert_expiry - time()) > 0)
+
count((certmanager_certificate_expiration_timestamp_seconds - time()) < 2592000 and (certmanager_certificate_expiration_timestamp_seconds - time()) > 0)
Panel 3: Expiry Timeline (Time Series)
x509_cert_expires_in_seconds / 86400Set thresholds: Red < 7, Orange < 14, Yellow < 30, Green > 30.
Complete Docker Compose Stack
For a quick local setup or testing environment:
# docker-compose.yml
version: '3.8'

services:
  prometheus:
    image: prom/prometheus:latest
    ports:
      - "9090:9090"
    volumes:
      - ./prometheus.yml:/etc/prometheus/prometheus.yml
      - ./rules:/etc/prometheus/rules
    command:
      - '--config.file=/etc/prometheus/prometheus.yml'
      - '--storage.tsdb.path=/prometheus'

  alertmanager:
    image: prom/alertmanager:latest
    ports:
      - "9093:9093"
    volumes:
      - ./alertmanager.yml:/etc/alertmanager/alertmanager.yml

  grafana:
    image: grafana/grafana:latest
    ports:
      - "3000:3000"
    environment:
      - GF_SECURITY_ADMIN_PASSWORD=admin
    volumes:
      - grafana-data:/var/lib/grafana

  blackbox-exporter:
    image: prom/blackbox-exporter:latest
    ports:
      - "9115:9115"
    volumes:
      - ./blackbox.yml:/etc/blackbox_exporter/config.yml

  x509-exporter:
    image: enix/x509-certificate-exporter:latest
    ports:
      - "9793:9793"
    volumes:
      - /etc/ssl/certs:/certs:ro
    command:
      - --watch-dir=/certs
      - --listen-address=:9793

volumes:
  grafana-data:
Start the stack:
docker compose up -dFAQ
Q: How often should Prometheus scrape certificate metrics?
For certificate expiry monitoring, every 60-300 seconds is sufficient. Certificates don’t change frequently, and scraping too often wastes resources. The Blackbox exporter can run at 5-minute intervals without issue. The x509-exporter watches file changes and updates metrics immediately, so even a 60-second scrape interval catches renewals quickly.
Q: Can I monitor certificates on Windows servers with this stack?
Yes. The x509-certificate-exporter has a Windows binary. Run it as a Windows service pointing to your certificate files, and configure Prometheus to scrape it. Alternatively, use the Blackbox exporter to probe Windows IIS endpoints externally.
Q: What’s the difference between x509-certificate-exporter and Blackbox exporter?
The x509-certificate-exporter reads certificate files directly (on disk or from Kubernetes secrets). It sees all certificates regardless of whether they’re actively serving traffic. The Blackbox exporter probes live HTTPS endpoints — it only sees certificates that are actually bound and serving. Use both: x509-exporter for internal/file-based certs, Blackbox for external endpoint validation.
Q: How do I monitor certificates behind a load balancer?
Use the Blackbox exporter pointed at the load balancer’s public endpoint. It will see whatever certificate the LB presents. For backend certificates (between LB and origin), use the x509-certificate-exporter on the backend servers, or probe internal endpoints if the Blackbox exporter has network access.
Q: Will these alerts fire during certificate renewal (brief overlap period)?
The for clause in alert rules prevents transient alerts. A 1-hour for duration means the condition must persist for a full hour before firing. During automated renewal (e.g., cert-manager or Certbot), the new certificate is typically in place within minutes, so the alert never fires.
Q: How do I handle alert fatigue from certificates I can’t control (third-party)?
Add label-based silences in AlertManager for known third-party certificates, or create a separate route with longer repeat_interval. You can also use recording rules to exclude specific instances from alert evaluation.
Related Reading: